MEAM.Design - MEAM 247 - P2: Uniaxial Loading
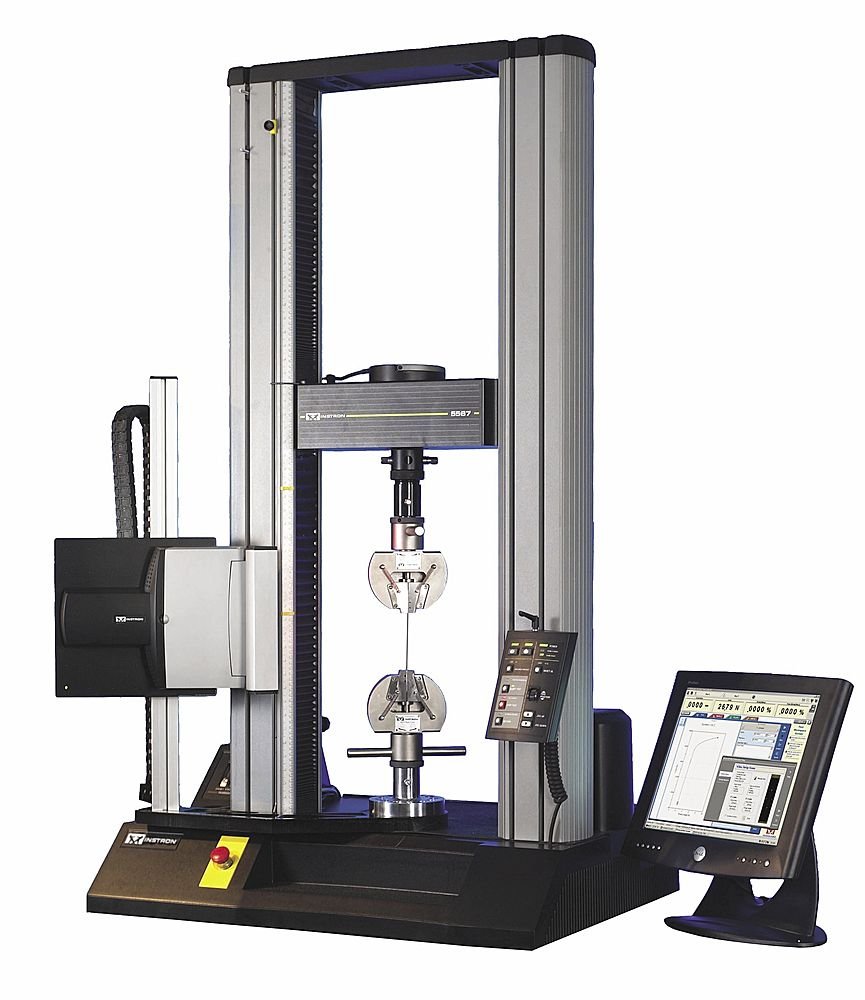
Using an Instron testing machine (an example of which is shown to the right), we will study the deformation and failure characteristics of a number of materials under tensile and compressive loads. We will begin by obtaining a force-displacement curve for each material, which can then be combined with accurate measurements of the samples to determine the modulus of elasticity, yield stress, ultimate tensile stress, ultimate compressive stress, and ductility of each sample. Once you have gathered and analyzed your data, you will assemble your results into a well-crafted lab report.
Dates & Deadlines
| Tuesday, 10/13 & Thursday, 10/15 | prelab due before your section, then in LRSM for testing |
| Tuesday, 10/20 & Thursday, 10/22 | in LRSM for testing |
| Monday, 11/9 @ 1:50 p.m. | report due |
Prelab
(:toggle label="Failure" hide prelab:)
1. One would expect that the elastic modulus calculated for the same material in tensile and compressive loading would be the same; however, the results are rarely in exact agreement. Discuss possible reasons for discrepancy.
2. Think about something that you've owned or used that has broken (or, if you must, go break something of little value). Can you relate the failure of the object to the basic mechanics of materials concepts (stress, strain, ductility, etc.) discussed here? Please describe.
Submit the answers to these two questions in the body of an email to medesign@seas.upenn.edu with the title 247-P2-prelab. The timestamp on the email must be before the start of your lab section.
Background
(:toggle label="Overview" hide overview:)
(:toggle label="Tensile Loading" hide tensile:)
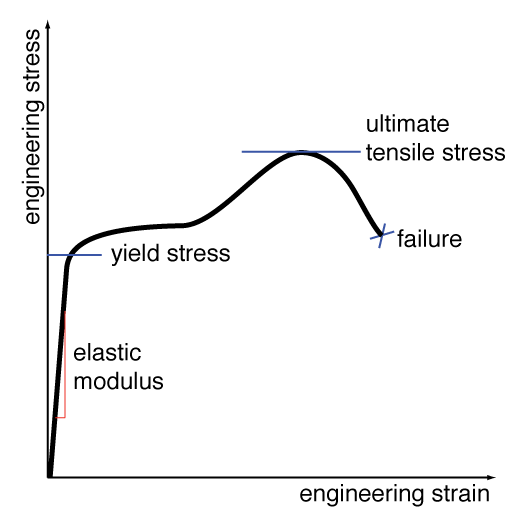
Plotting the engineering strain (change in length divided by original length) versus the engineering stress (applied force divided by the original cross-sectional area) in a sample can provide many insights into the material properties. A representative stress-strain plot for a tensile-loading case is shown to the left. NOTE: This plot is representative and is NOT drawn to scale.
Examining the curve at small strain values, we find that the relationship between stress and strain is nearly linear, and we take the slope of the curve in this region to be the elastic (or Young's) modulus.
As the load on the specimen is increased, the stress-versus-strain relationship becomes nonlinear, and further loading will result in plastic deformation. The point of transition between elastic (linear) and plastic (nonlinear) behavior is know as the yield point or yield stress.
Upon further loading, we reach the point of maximum engineering stress which is known as the ultimate tensile stress or UTS.
Most brittle materials (such as cast iron, acrylic, and most ceramics) exhibit little-to-no plastic deformation before failure, and as such their yield point, ultimate tensile stress, and failure point are often coincident.
(:toggle label="Compressive Loading" hide comp:)
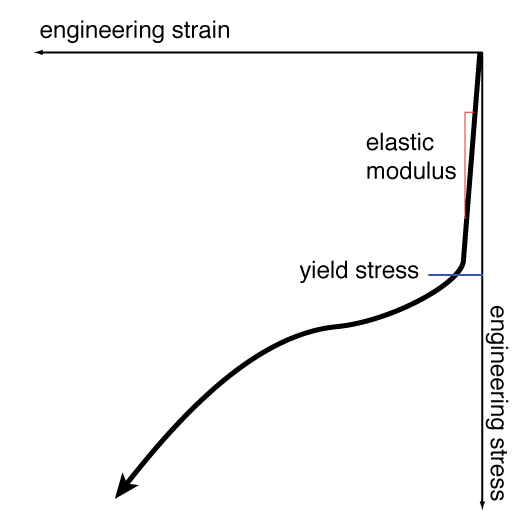
A representative stress-strain plot for a specimen loaded in compression is shown to the left. Once again, these are engineering stress and engineering strain. NOTE: This plot is representative and is NOT drawn to scale.
Examining the curve at small strain values, we find that there exists a linear relationship between stress and strain, the slope of which should match the elastic (or Young's) modulus found during tensile loading.
As the load on the specimen is increased, the stress-versus-strain relationship becomes nonlinear, and further loading will result in plastic deformation. The point of transition between elastic (linear) and plastic (nonlinear) behavior is know as the compressive yield point or compressive yield stress.
Under compressive loading, the maximum stress, or ultimate compressive stress, will always be experienced at the point of failure, due in part to an effect known as packing, wherein compressive forces will close cracks which would induce failure during tensile loading. This packing effect also allows many materials to withstand significantly higher loads in compression.
When the compressive specimen is relatively ductile, the Poisson effect causes the cross-sectional area to increase under load (the inverse of necking found in ductile tensile specimens), and as the specimen slowly flattens out it can be difficult to quantify the point of failure. In contrast, brittle materials often have a specific compressive fracture point at which the material splits.
It is important to note that slender specimens (typically defined as a length-to-diameter ratio of more than than 3:1) will often buckle before reaching compressive failure.
(:toggle label="Behavior of Metals" hide metals:)
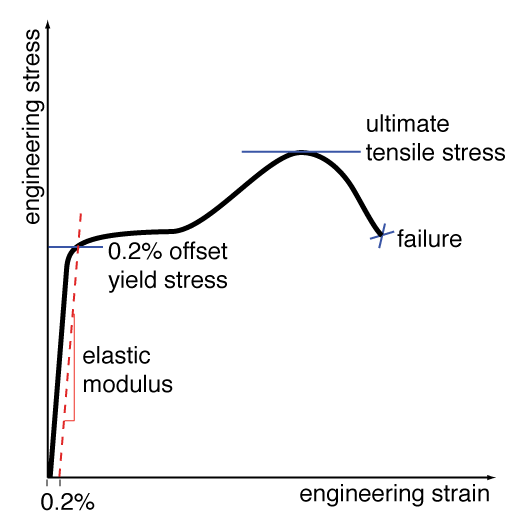
The curve shown to the right is common for many metals.
Elastic Modulus - At small strain values, the relationship between stress and strain is quite linear, making the estimation of the elastic modulus relatively easy.
Yield Point - Many metals lack a sharp yield point (i.e. a sudden, observable transition between elastic and plastic deformation), and as a result the yield point is defined empirically as the stress that corresponds to 0.2% permanent plastic strain. This value can be determined graphically by finding the intersection of the stress-strain curve with a line of slope equal to the elastic modulus passing through the strain axis at 0.2% (or 0.002 in/in).
Ultimate Tensile Stress (UTS) - By examination of the stress-strain plot, this is simply the maximum engineering stress which the material could withstand.
(:toggle label="Behavior of Polymers" hide polymers:)
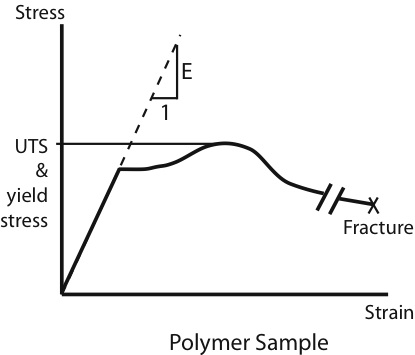
The stress-strain curve for a polymer (such as polyethylene or nylon) differs from that of a metal in both shape and magnitude. The most noticeable difference is that polymers typically reach strain values that are orders of magnitude higher than most metals due to a process known as "drawing".
Elastic Modulus - The elastic modulus for a polymer is found in exactly the same manner as it is for a metal (measuring the slope of the stress-strain curve for small strains), although it is important to recognize that some polymers can exhibit significant nonlinear behavior in the elastic region.
Yield Point and Ultimate Tensile Stress - By definition, the yield point and ultimate tensile stress for polymers are defined as the maximum engineering stress achieved by the material.
(:toggle label="Anisotropic Materials" hide ani:)
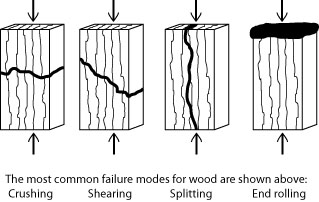
While most of the materials that we will study will be isotropic (uniform properties in all directions), there are many materials wherein the properties differ by direction. Some natural materials (e.g. wood) and many of today�s engineered composites (e.g. carbon fiber) are anisotropic. In wood, which is composed of long slender packets of cellulose enclosed by void areas, the long, fibrous nature of the grain leads to very pronounced anisotropic behavior. The image to the right depicts four different failure modes for a typical wooden specimen loaded along the grain.
Procedures
(:toggle label="Tensile Testing" hide tension:)
2. Load the material sample into the Instron testing machine.
3. To accurately measure strain within the elastic region, you will want use an extensometer clip gauge attached to the sample. This precision instrument has a limited range, and must be removed once past the material's yield point.
4. The speed and maximum load level will be programmed into the machine, and the specimen will be stretched automatically.
5. Once failure occurs, remove the sample from the machine and record the surface characteristics (color, texture, shape) at the fracture point (you will want these notes for your report). In addition, note the nature of the plastic deformation in each material (i.e. necking, brittle fracture, extensive plastic flow, etc.). Finally, estimate the final cross-sectional area in the region of fracture and place the two halves of the sample together and estimate the final gage length.
6. Do not forget to save a copy of the data file from the PC.
(:toggle label="Compressive Testing" hide compression:)
2. Load the material sample into the Instron testing machine and place the plastic shield between you and the specimen (compressive loading can often result in the specimen being ejected from the machine).
4. The speed and maximum load level will be programmed into the Instron, and the specimen will be compressed automatically.
5. Once failure occurs, remove the sample from the machine and record the specimen characteristics (color, texture, shape) and note the nature of the plastic deformation in each material (i.e. brittle fracture, extensive plastic flow, etc.). Finally, estimate the final cross-sectional area and length of the specimen.
6. Do not forget to save a copy of the data file from the PC.
(:toggle label="Hardness Testing" hide hardness:)
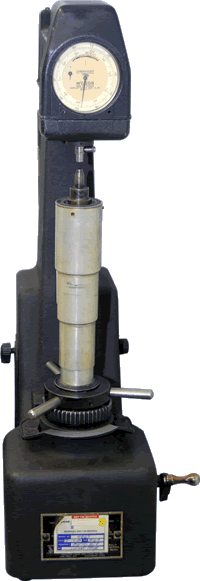
In contrast to the destructive tests performed above, it is often desirable to obtain estimates of material properties without destroying the specimen. Using measurements of hardness (i.e. - the resistance of a material to deformation), it is possible to estimate the ultimate tensile stress (UTS) while causing only a small indentation on the surface of the sample. There are many methods which have been developed to measure hardness. For the purposes of this lab we will use the Rockwell Scale. The Rockwell Scale is divided into a B scale for softer materials (aluminum, brass, soft steels, etc.) and a C scale for harder materials. These two scales correspond to the type of indenter and the amount of force which is applied: The B scale uses a hardened steel ball with a 100-kg weight, while the C scale uses a diamond cone (called a Brale indenter) with a 150-kg weight.
1. Make sure that the Rockwell tester is set up with the proper indenter and weight, then place the specimen in the v-shaped holder.
2. Slowly raise the sample up to the indenter by turning the spoked wheel. Once the indenter comes into contact with the specimen, watch the small needle on the display and continue to turn the spoked wheel until this needle is pointing at the dot.
3. Zero the Rockwell gauge by turning the bezel until the long needle is pointing at the zero mark.
4. Turn the lever on the right away from you (CW), and wait until the needle comes to a stop.
5. Flip the lever back toward you (CCW), and read the value from the dial (make sure to read the value corresponding to the proper scale based on the indenter and weight).
Testing & Analysis
(:toggle label="Experiments" hide experiments:)
(:toggle label="Analyzing Your Data" hide analysis:)
2. Using the tensile test results, estimate the yield stress, ultimate tensile stress, and elastic modulus.
3. Using the compressive test results, estimate the yield stress, ultimate compressive strength, and elastic modulus.
4. Using the hardness testing, estimate the ultimate tensile strength of each specimen.
5. Calculate the ductility of each specimen by dividing the change in cross-sectional area by the original cross-sectional area.
6. Estimate the work done to fracture each tensile specimen, which can be computed as the area under the load-deflection curve, or the initial volume of the gage section times the area under the stress-strain curve up to fracture (you may want to use Matlab to conduct this analysis).
7. Finally, estimate the toughness of the tensile specimens, which is defined as the integral of the stress curve from zero to fracture strain (i.e. - the area under the stress-strain curve to fracture).
(:toggle label="Analyze Some Reference Samples" hide analysis2:)
Presentation of Results
(:toggle label="Report Structure" hide structure:)
(:toggle label="Required Components" hide components:)
2. Include properly formatted tensile stress-strain plots for the five (or more) reference materials.
3. Present a table listing the material properties (where appropriate) for each specimen, including:
tensile yield stress
compressive yield stress
ultimate tensile strength (from tensile testing)
ultimate tensile strength (from hardness testing)
ultimate compressive strength
hardness
ductility
toughness
4. Characterize the different materials you examined. You should compare and contrast the materials you tested on the basis of fracture surface properties, plastic deformation, and other observed characteristics. Can certain features of the stress-strain curves be used to predict the type of plastic deformation and fracture that will occur in a material?
5. Compare the tensile and compressive behavior of the cast iron specimen. Do the same for the aluminum specimen. Be sure to theorize about the origin of any discrepancies.
6. Compare the estimates of ultimate tensile stress obtained from the tensile tests with those found using the hardness testing machine. Do the estimates differ, or are they the same? If they differ, discuss the possible cause(s) for the discrepancy.
7. Include a comparison between your experimentally-determined material properties and published values of yield stress, UTS, UCS, and elastic modulus. Discuss the possible origins of any discrepancies, and be sure to cite the source for published values.
8. Perform a scientific error analysis for one of tensile experiments which you conducted using the Instron. Qualitatively discuss the effect of any inaccuracies in your estimates of the various parameters. You can assume the following accuracies: load cell (0.5% of full-scale load), crosshead displacement transducer (+/-0.0005 in). Also consider the error in the devices and methods used to measure the specimen dimensions. Which sources of error are most dominant in obtaining estimates of Young�s modulus, ultimate tensile strength, and toughness? (More information on error analysis can be found here).
9. Lastly, find a place where one of the materials that you examined is used. Investigate why this particular material has been chosen for this purpose (be sure to document all sources). Make an argument for the replacement of the material with another from the list of reference materials. It is important that you address trade-offs which would need to be made (cost, manufacturability, aesthetics, etc.).
(:toggle label="Submission Instructions" hide submit:)