MEAM.Design - MEAM 247 - P2P2: Concentration
Project 2, Part 2: Concentration
Prelab
(due 11:59 p.m. on 11/2)
Send the answers to the following questions in an email to medesign@seas.upenn.edu entitled 247-P2P2-Prelab before 11:59 p.m. on Wednesday, November 2nd:
1. What are the yield stress, young's modulus, and poisson's ratio for polycarbonate? From where did you obtain your values?
2. What is the maximum load, P, that should be applied to the plate to ensure that we do not exceed the yield stress at any location in the plate?
3. Find an example of something that has failed (or looks like it is going to fail) due to a geometric stress concentration. Include a photograph of the situation, and include a brief description of the situation.
Background
In this lab we will use a number of different methods to examine how geometric features influence the stress and strain within a planar specimen. See here for more information concerning the underlying theory of plane stress and strain, net-section stress, stress concentrations for round holes, St. Venant's principle, and photoelasticity.
Experimental Procedures
1 Predictions
Based on the theory described in the Background section, use Matlab to plot the expected ($\sigma_y$) along one half of the H-H cross-section of the plate. Does the profile match your intuition? Save your plot for later comparison with the experimental data.
2 Finite-Element Analysis
Using SolidWorks, create a 3-dimensional model of the central region of the plate (W = 10 inches, t = 0.211 inches, L = 12 inches, hole radius = 0.5 inches centered in the plate), then follow the instructions posted
here to set up and run a linear static analysis on the plate.
Save an image showing the mesh that you used.
Save a plot of the vertical stress, ($\sigma_y$), throughout the plate. Paying particular attention to the bisection line (H-H), do the finite-element model results match up with the theoretical prediction from part 1? Also examine the stress around the circumference of the hole to see if it matches with the theoretical predictions.
Save a plot of the maximum in-plane shear stress, ($\tau_{max}$), throughout the plate.
You may also want to investigate the animation options, which will produce video files that could be overlaid with the photoelastic results in part 4 below.
(For parts 3 and 4, you will need to spend ~45 minutes in the LRSM working with the experimental setup. A sign-up sheet of available testing times is posted to the wall in Towne 205.)
3 Photoelastic Visualization
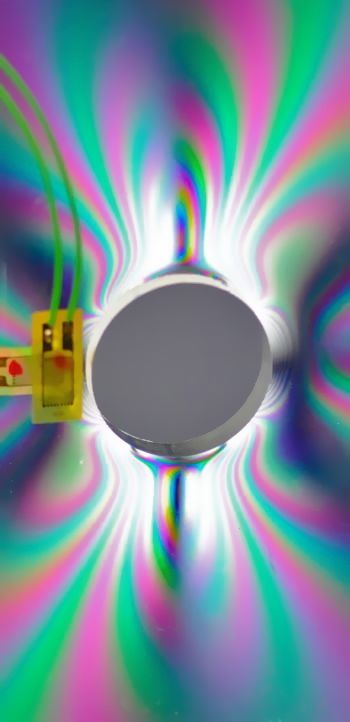
With the polarizing light source and filter arranged around the polycarbonate plate, visually observe the stress fringes produced via photoelasticity. Use a camera to capture images and/or video of what you see, paying particular attention to the state of stress around the hole.
4 Strain Gauges
To experimentally confirm the predicted stress at the midplane, a set of strain gauges have been distributed along the H-H cross section. You will see that we have placed gauges to measure both the X and Y components of strain at each point, thereby allowing you to use the plane stress equations above to find ($\sigma_x$) and ($\sigma_y$).
We will use the Instron testing machine to apply a moderate tensile load to the plate. It is critical that the maximum stress within the plate not exceed the yield point at any time.
Presentation of Results
(due 2:00 p.m. on 11/14)
Compare and contrast your results from the above four methods (theoretical calculations, finite-element analysis, photoelastic observation, and experimental strain-gauge data) and present your results in one of the following formats:
A: Working solo, prepare a 5-page-maxium report, similar to the one written for Part 1 of Project 2. Submit a hard copy of your report at the beginning of class.
B: Either solo or in pairs, create an explanatory video (2 minutes maximum). Post your video to YouTube or Vimeo, and send an email to medesign@seas.upenn.edu entitled 247-P2P2-video with both the link and the name(s) of those involved in the body of the message.
