PrecisionRecall
Performance measures
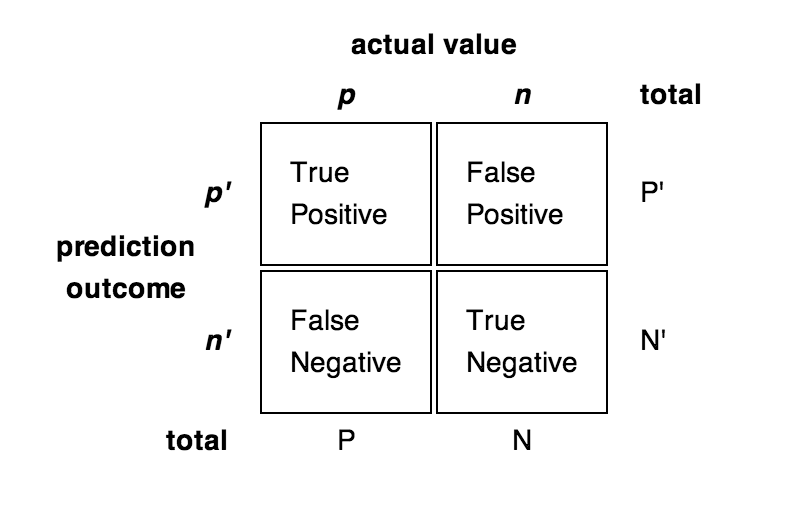
accuracy (ACC)
- {$\mathit{ACC} = (\mathit{TP} + \mathit{TN}) / (P + N)$}
precision = positive predictive value (PPV)
- {$\mathit{PPV} = \mathit{TP} / (\mathit{TP} + \mathit{FP})$}
recall = sensitivity = true positive rate (TPR)
- {$\mathit{TPR} = \mathit{TP} / P = \mathit{TP} / (\mathit{TP}+\mathit{FN})$}
false positive rate (FPR)
- {$\mathit{FPR} = \mathit{FP} / N = \mathit{FP} / (\mathit{FP} + \mathit{TN})$}
specificity (SPC) = True Negative Rate
- {$\mathit{SPC} = \mathit{TN} / N = \mathit{TN} / (\mathit{FP} + \mathit{TN}) = 1 - \mathit{FPR} $}
negative predictive value (NPV)
- {$\mathit{NPV} = \mathit{TN} / (\mathit{TN} + \mathit{FN})$}
false discovery rate (FDR)
- {$\mathit{FDR} = \mathit{FP} / (\mathit{FP} + \mathit{TP}) = 1 - \mathit{PPV} $}
F1 score = harmonic mean of precision and recall
- {$\mathit{F1} = 2 \mathit{TP} / (P+P') = 2 \mathit{TP} / (2 \mathit{TP} + \mathit{FP} + \mathit{FN})$}
ROC Curves
Order the predicted examples from highest score (highest probability of have a label of "yes") to lowest score. As one moves down the list, including more examples, the number of true positives will at first increase rapidly, and then more slowly. One can view the x-axis as the number of items we label as "yes" and the y-axis as the number of those items that really were "yes". Or you can normalize them to run from 0 to 100%.
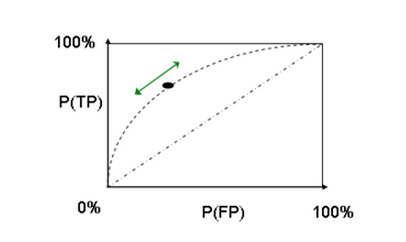
Random guessing will give a 45 degree line on this plot. The higher the ROC curve is, the more accurate (on average) the prediction is. Thus, one can measure quality of the model using the area under the curve (AUC). AUC=0.5 is random guessing, AUC=1.0 is perfect prediction.